Instrumentation and Optimization of Win32/Intel Executables Using Etch
Ted Romer, Geoff Voelker, Dennis Lee, Alec Wolman, Wayne Wong, Hank Levy, and Brian Bershad
University of Washington
Brad Chen
Harvard University
etch-info@cs.washington.edu
Abstract
Etch is a general-purpose tool for rewriting arbitrary Win32/x86 binaries without requiring source code. Etch provides a framework for modifying executables for both measurement and optimization. Etch handles the complexities of the Win32 executable file format and the x86 instruction set, allowing tool builders to focus on specifying transformations. Etch also handles the complexities of the Win32 execution environment, allowing tool users to focus on performing experiments. This paper describes Etch and some of the tools that we have built using Etch, including a hierarchical call graph profiler and an instruction layout optimization tool.
1 Introduction
During the last decade, the Intel x86 instruction set has become a mainstay of the computing industry. Arguably, Intel processors have executed more instructions than all other computers ever built. Despite the widespread use of Intel processors and applications, however, few tools are available to assist the programmer and user in understanding or exploiting the interaction between applications, the processor, and the memory system on x86-based platforms. At the University of Washington, we have been building a software architecture based on binary rewriting for developing such tools on Intel x86 platforms running Win32.
This paper describes Etch, a binary rewriting system for Win32 applications that run on Intel x86 processors. We developed Etch to aid programmers, users, and researchers in understanding the behavior of arbitrary applications running on Intel architectures. Application source is not required to rewrite a program. Etch supports general transformations on programs, so that they can also be rewritten to optimize their performance, without access to the original source code.
Etch is targeted at three different user groups: architects, who wish to understand how current application workloads interact with the architecture of a computer system; developers, who wish to understand the performance of their programs during the development cycle; and users, who wish to understand and improve the performance of common applications executing in their environment. Etch provides all three groups with measurement tools to evaluate performance at several levels of detail, and optimization tools to automatically restructure programs to improve performance, where possible.
Previous binary modification tools such as pixie [Chow et al. 1986], ATOM [Srivastava & Eustace 1994] and EEL [Larus & Schnarr 1995] run on RISC-based UNIX systems. Other tools for modifying x86 programs, such as MPTrace [Eggers et al. 1990], run on UNIX systems and require access to compiler-generated assembly language versions of the input programs. In contrast, Etch, like TracePoint’s Hiprof call graph profiling tool [TracePoint 1997], works directly on Win32 x86 binaries. This environment creates several challenges that are not present in UNIX-based environments, including:
- code discovery: The complexity of the x86 instruction set and the current practice of interleaving data and executable instructions in the text segment make it difficult to statically discover code within an executable image. Although the structure of the Win32 PE header is well defined [Pietrek 1994], there is no standard that defines an executable's internal structure. Internally, a binary can contain code, data, and jump tables in an arbitrary order, and the format commonly changes from compiler to compiler. A binary rewriting tool must be able to accurately distinguish between code and data so that it can rewrite code while leaving data intact. Failure to make this distinction can result in a broken executable or in large amounts of uninstrumented code.
- module discovery: Win32 applications are commonly composed of a top level executable and a large number of dynamically linked libraries (DLLs). Although some of the libraries may be statically identified in the executable headers, many are identified and loaded dynamically. In this case the names of the DLLs to be loaded by an application can only be determined by running the program. Transformation of such a loosely structured application requires that an instrumentation tool be able to identify all the DLLs used by a program. In contrast, most UNIX applications are composed of a single statically loaded executable, or an executable and a relatively small number of shared libraries.
- environment management: A Win32 application executes in a context, which includes its working directory and the program name by which it was invoked. Unlike typical UNIX applications, many Win32 applications are sensitive to this context and may not work when the module used by the application is copied or moved into a different directory. Consequently, it is necessary to run a transformed executable within a protective "shell" that makes it appear as though the Win32 executable is running in its original context.
2 The Model
Etch is a system framework that supports integration of nearly any type of measurement and optimization tool, similar to systems such as ATOM and EEL. Etch permits measurement tools to instrument an x86 binary so that the application program, when executed, produces the required measurement data as it runs. For example, one tool may instrument the program to produce a trace of all memory reads and writes, while another may instrument the program to record the number of conditional branch instructions that succeed or fail. Furthermore, because Etch allows complex modifications to the executable binary, Etch tools can also rewrite the program in order to improve its performance. For example, an Etch tool may reorder instructions to optimize for the pipeline structure of a particular processor implementation, or it may relocate procedures to improve memory system locality and behavior.
Etch separates the process of instrumenting and tracing an executable into two phases: an instrumentation phase and an analysis phase. Similarly, each tool is split into two components, an instrumentation module and an analysis module. During the instrumentation phase, Etch processes the program in order to "discover" the components of the program, e.g., instructions, basic blocks, and procedures. As Etch discovers each component, it calls into the tool’s instrumentation module, telling the module what it discovered. At each such callback, the instrumentation module has the opportunity to instruct Etch to examine and possibly modify the executable, e.g., to insert measurement instructions before or after an instruction, basic block, or procedure. These inserted instructions may include calls to procedures in the analysis module, which will be loaded with the executable at run time (the analysis phase). Thus, when the program runs, it will execute the additional inserted code, including calls into the tool analysis routines that record or process crucial measurement information. Finally, when the program completes, the analysis module is given an opportunity to run analysis routines required to process the data collected during execution.
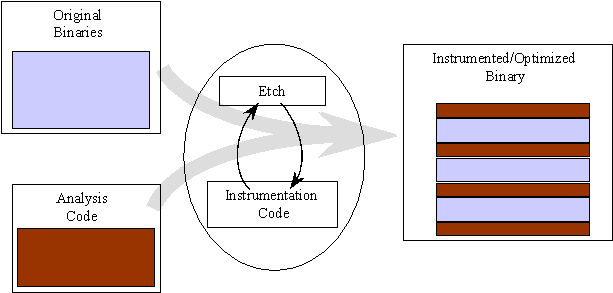
Figure 1: Etch transforms a program according to some instrumentation code, which can add new code into the program, take old code out, or simply reorder pieces of the program.
InstrumentModule(thisModule, Before)
For each procedure in the program:
    InstrumentProcedure(thisProcedure, Before)
    For each basic block in the Procedure:
        InstrumentBasicBlock(thisBasicBlock, Before)
        For each instruction in the Basic Block:
            InstrumentInstruction(thisInstruction, Before)
            InstrumentInstruction(thisInstruction, After)
        InstrumentBasicBlock(thisBasicBlock, After)
    InstrumentProcedure(thisProcedure, After)
InstrumentModule(thisModule, After)
Figure 2: As Etch discovers program components during program instrumentation, it invokes instrumentation code for that component: once before the component is written to the new executable, and once after. The im-plementations of the Instrument* routines may direct Etch to add new code before and/or after the specified component.
Figure 1 illustrates the general transformation of an executable using Etch. As Etch discovers pieces of the original executable, it invokes the instrumentation code in the manner indicated in Figure 2. The instrumentation tool provides implementations of "Before" and "After" functions. These functions can in turn direct Etch to modify the executable with respect to the specific instruction. The directions in effect say "before (or after) this instruction runs, please call some specific function with some specific set of arguments." For example, to count instructions, the InstrumentBefore procedure would direct Etch to insert a call to a procedure that incremented a counter at run time. Instrumentation code can add, remove, or modify instructions, or add procedure calls at any point in the executable. There are provisions for communicating program state (such as register values) into analysis code at run time. By default, all program state is with respect to the original executable.
Once the entire executable has been traversed, Etch generates a new version of the executable that includes the instructions added during instrumentation. The functions called at instrumentation points, as well as the Etch run time library, are linked (dynamically loaded) by the new executable. When the executable written by Etch is run, analysis routines will run as a side effect of running the program. These instrumentation routines can inspect the state of the program, for example, the contents of registers, or effective addresses. All addresses, whether text or data, are relative to the original binary, so the collection routines do not have to reverse-map these addresses at run time.
The transformations performed on the binary by Etch should not change program correctness, although it is of course possible to write instrumentation or analysis code that causes a program to break when it executes. A program transformed for performance measurement collection may run more slowly depending on the number of additional instructions that must be executed. Etch does not require changes to the operating system, but Etched binaries may utilize OS facilities, such as software timers, or even implementation-specific facilities, such as Intel Pentium performance counters.
2.1 Measurement
A typical Etch measurement tool analyzes an application’s behavior as it runs, and at program termination saves information about the run to disk. For example, a cache simulation tool could examine the application’s memory reference stream and report cache miss rates for various cache configurations. A post-processing tool could then predict the application's execution time based on the cache miss rates and hypothetical processor, cache, and memory speeds. A different tool could simply display the cache miss data graphically, as illustrated in Figure 3. The graph shows the number of misses per instruction in the first level instruction cache and the second level unified cache for the Perl interpreter, three commercial C++ compilers, and Microsoft Word.
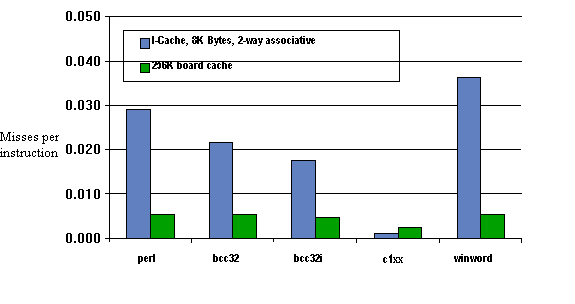
Figure 3: Cache miss data for a collection of popular NT applications.
2.2 Optimization
Etch also provides facilities for rewriting an executable in order to improve its performance. For example, it is possible to reorder instructions to optimize code layout for cache and VM behavior.
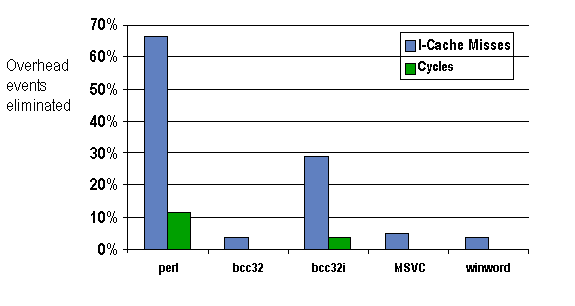
Figure 4: The performance impact of code layout optimization.
Figure 4 shows the reduction in instruction cache misses and execution time (in cycles) for a collection of popular Win32 programs that have been optimized for code layout using Etch on a 90Mhz Pentium. Etch was first used to discover the programs' locality while executing against a training input, and then to rewrite the applications, in order to achieve a tighter cache and VM packing. Infrequently executed basic blocks were moved out of line, and frequently interacting blocks were laid out contiguously in the executable, using an algorithm based on Pettis and Hansen [Pettis & Hansen 1990]. The results were measured using hardware performance counters. Different inputs were used for training and testing.
2.3 Call Graph Profiling
An example of a relatively complex Etch tool is the Etch call-graph profiler, CGProf. CGProf shows program activity in terms of the program’s dynamic call-graph, a format originally used by the UNIX gprof profiler [Graham et al. 1983]. CGProf is designed to give precise and complete information about the bottlenecks and time-sinks in an application. Etch and CGProf can use debugging information to provide output using procedure names. When source code is also available, a coordinated GNU Emacs browsing mode provides point-and-click navigation of source from CGProf profiles. CGProf provides multiple views of profile information to help developers identify bottlenecks at different structural levels. These views include a per-module and per-procedure view, to identify the modules and procedures where execution time is spent, as well as the hierarchical view illustrated in Figure 5.
Call Graph Profile:
    parents
name                                       %time  %self  %desc  calls
    children

"SYNCH.EXE",_threadstart [1:29]             89.0    0.0   89.0  2
    "SYNCH.EXE",CopyToScreen [1:1]                  0.0   88.0  2
    DllCall:,"KERNEL32.dll",TlsSetValue [0:12]      0.0    0.0  2
    "SYNCH.EXE",_endthread [1:30]                   0.0    0.0  2
----------------------------------------------------
    "SYNCH.EXE",_threadstart [1:29]                 0.0   88.0  2
"SYNCH.EXE",CopyToScreen [1:1]              89.0    0.0   88.0  2
    "SYNCH.EXE",Lock::Release [1:9]                 0.0    0.0  4
    "SYNCH.EXE",Lock::Acquire [1:8]                 0.0    0.0  4
    "SYNCH.EXE",getc [1:20]                         0.0    4.0  1310
    "SYNCH.EXE",Condition::Signal [1:13]            0.0    0.0  2
    "SYNCH.EXE",fopen [1:27]                        0.0    1.0  2
    "SYNCH.EXE",putchar [1:22]                      0.0   80.0  1308
Figure 5: Excerpt of typical hierarchical call graph profiler output. For each procedure the output includes: the name of the module (executable or DLL); the name of the procedure itself; a unique identifier for the procedure; the time spent in the procedure, in its callers (parents) and in its callees (children); and the number of calls from each caller to the procedure and from the procedure to each callee.
CGProf uses Etch instrumentation to monitor all procedure calls and returns during execution rather than statistical sampling commonly found in other profilers. CGProf can count either cycles or instructions to quantify activity in application modules. When counting cycles, the tool uses the hardware cycle counter to measure path lengths. When counting instructions, CGProf instruments every basic block to add the length of the basic block to a counter.
3 Using Tools Written With Etch
There are three basic ways to use tools developed with Etch: one-at-a-time by hand; using a GUI; or through a tool-specific wrapper from the command line. The first, and most primitive, is to simply invoke Etch for each component in a program, passing in as an argument the name of the tool and the program component. For complex programs, this can be somewhat tedious and error prone, as it is necessary to specify each program component one at a time.
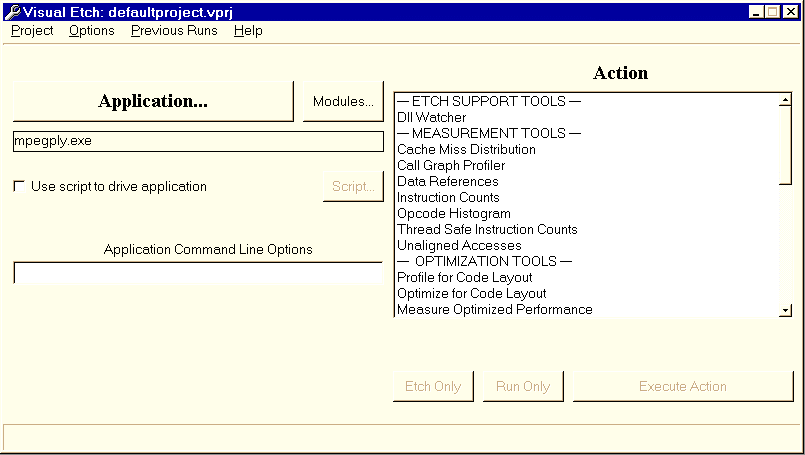
Figure 6: The Visual Etch user interface.
The second and more convenient way to run Etch is to use a graphical user interface. The Etch GUI (Visual Etch) makes a standard collection of tools available to Etch users without requiring that they write or understand the mechanics of building Etch tools. Our goal in developing the GUI was to make it extremely easy for the naïve user (such as an undergraduate programmer in an architecture course) to be able to run sophisticated experiments on commercial software. As such, it very much follows the "point, click, and go" model of control as illustrated by Figure 6. The user simply specifies a program and a tool, runs the program as modified by the tool, and then looks at the output.
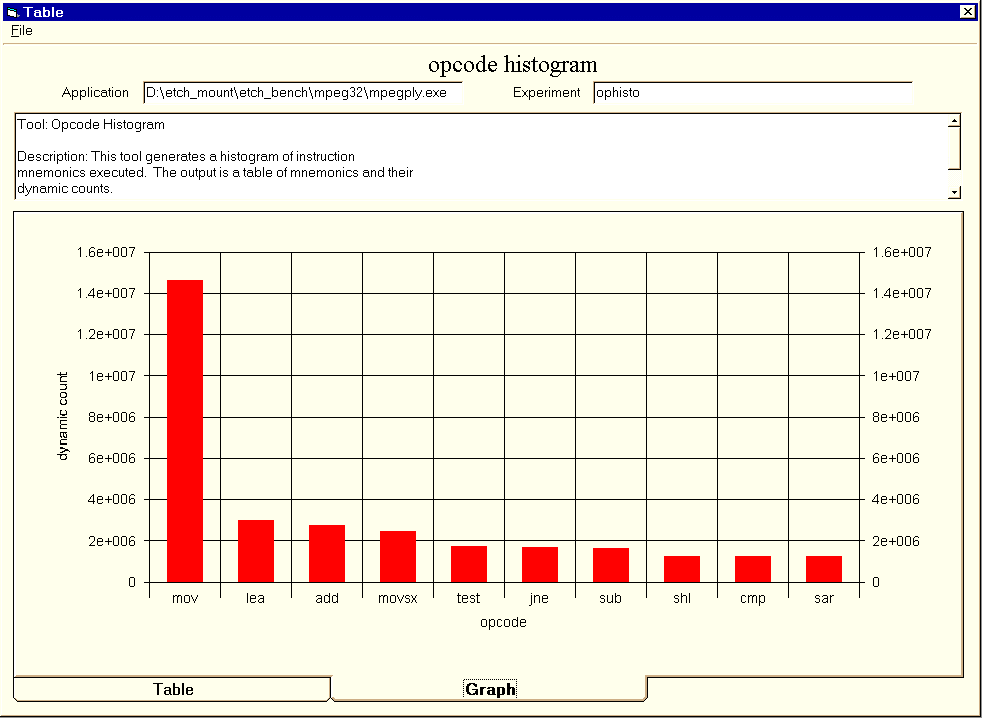
Figure 7: Sample results showing distribution of instruction opcodes.
The user interface determines all of the program components, drives the rewriting process and ensures that whatever environment (e.g., working directory, data files, etc.) was initially available to the original executable is available to the transformed executable at run time. The GUI first runs Etch on the original binary to produce a new binary that has been modified to collect the necessary data. It executes the modified binary to produce the data, and feeds the data to analysis tools that produce graphs or charts that illustrate behavior or pinpoint problems. For example, Figure 7 shows the output from an opcode histogram tool that displays the distribution of instruction types for an MPEG player. If Etch is being used to optimize performance, the user may instruct Etch to apply a performance-optimization transformation. For example, Etch may rewrite the original binary to change the layout of data or code in order to improve cache or virtual memory performance, as was illustrated in Figure 4.
The third way to run Etch is by using a command line version of the instrumentation front end. Our command line front end is based on a generic wrapper program that is specialized at compile time to the specific instrumentation tool with which it will be used. For example, we compile the wrapper along with the CGProf libraries to build the program CGInstrument. CGInstrument can then be used to instrument applications for call-graph profiling. Once instrumented, the profiled application can be run, and then another command, CGProfile , is used to post-process the raw profile information. For example, the sequence of commands to instrument and profile notepad.exe would be:
C:> cginstrument notepad.exe
C:> notepad-cgprof.exe
C:> cgprofile notepad.exe
The first step takes the original program (in this case notepad.exe) and all of its DLLs and produces versions that have been transformed to collect profile information. The second step runs the transformed version of the program (and uses all of the transformed DLLs), calling into the run time analysis routines to generate an output file containing profile information. Finally, the third step converts this output file into human-readable text.
The CGProf command line interface makes it possible to include profiling with CGProf as a part of an automated build/test environment, rather than requiring interaction with a GUI. The CGProf command line interface manages the discovery and instrumentation of all the modules used by an application. It can watch the application during a training run to build the entire list of modules used by the application for a specific test and make the list available to the instrumentation process. Alternatively, new modules can be detected and instrumented while the profiling experiment runs. This makes it possible to eliminate the training run, and to accommodate slight variations in testing runs that cause new DLLs to be loaded.
4 Summary
Etch is a general binary rewriting tool for Win32 executables running on Intel architectures. Its key features are a generalized API that allows tools to be developed relatively quickly and run with relatively good performance. To learn more about the Etch project, or to obtain a version of this paper with color figures, please visit:
http://memsys.cs.washington.eduFor traces generated from a few popular Win32 programs on the x86, visit:
http://memsys.cs.washington.edu/memsys/html/traces.htmlReferences
[Chow et al. 1986]
Fred Chow, A. M. Himelstein, Earl Killian and L. Weber, `"Engineering a RISC Compiler System," IEEE COMPCON, March 1986.
[Eggers et al. 1990]
S. Eggers, D. Keppel, E. Koldinger and H. Levy, "Techniques for Efficient Inline Tracing on a Shared Memory Multiprocessor," Proceedings of the ACM Conference on Measurement and Modeling of Systems, May 1990.
[Graham et al. 1983]
S. Graham, P. Kessler, and M. McKusick. "An Execution Profiler for Modular Programs," Software - Practice and Experience, 13, pp. 671-685, 1983.
[Larus & Schnarr 1995]
James R. Larus and Eric Schnarr, "EEL: Machine-Independent Executable Editing", Proceedings of the 1995 ACM SIGPLAN Conference on Programming Languages Design and Impelementation (PLDI), June 1995.
[Pettis & Hansen 1990]
Karl Pettis and Robert Hansen, "Profile-Guided Code Positioning", Proceedings of the 1990 ACM SIGPLAN Conference on Programming Language Design and Implementation (PLDI), June 1990.
[Pietrek 1994]
Matt Pietrek, "Peering Inside PE: A Tour of the Win32 Portable Executable Format", Microsoft Systems Journal, Vol. 9, No. 3, pg 15-34, March 1994.
[Srivastava & Eustace 1994]
A. Srivastava and A. Eustace. "ATOM: A System for Building Customized Program Analysis Tools," Proceedings of the 1994 ACM SIGPLAN Conference on Programming Language Design and Implementation (PLDI), June 1994. See also DEC WRL Research Report 94/2.
[TracePoint 97]
