Profiling Recursive Procedures
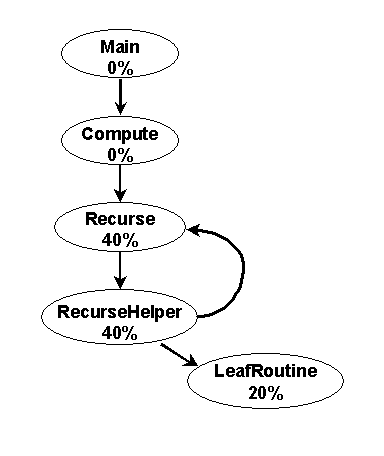
Recursive procedures introduce cycles into the call graph. The Etch Call Graph Profiler must detect recursion in order to present the profile information correctly. Figure 1 shows an example of a call graph annotated with self times for a program in which two procedures call each-other recursively.

Figure 1. A recursive example, annotated with self times.
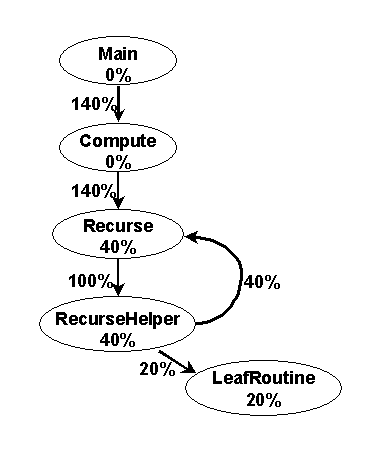
Notice that Recurse() is the child of two nodes, Compute() and RecurseHelper(), and this introduces a loop in the call graph between Recurse() and RecurseHelper(). If the profiler were to compute the descendant times for this call graph as it does for non-recursive call graphs, the results would be as shown in Figure 2. Recurse() is a descendant of RecurseHelper(), and its self time would be added to that of LeafRoutine() to get the total descendant time for RecurseHelper(). However, when the descendant time for Compute() is calculated, the self time for Recurse() is counted twice, once as a descendant of RecurseHelper() and once as a descendant of Compute(), resulting in an incorrect result.

Figure 2. Incorrect computation of descendant times for the recursive example.
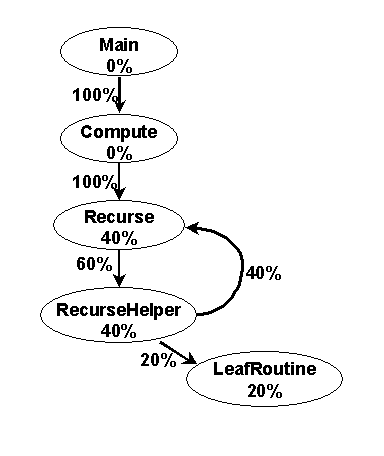
To prevent this problem, the profiler detects recursion while the application is running and propagates descendant time across recursive cycles without counting time twice over recursive cycles, as shown in Figure 3.

Figure 3. How the Etch Call Graph Profiler computes descendant times for recursion.
To indicate the presence of recursion, a '*' appears next to the procedure name in the minor entries for recursive procedure invocations. As it turns out, the recursion detection feature of the Etch Call Graph Profiler is important for interactive Windows programs, as recursive calls of event-handling routines are common.
Copyright (c) 1997 The University of Washington. All rights reserved.