Reading Profile Output
The profile output from the Etch Call Graph Profiler provides four different views of profile information:
- Execution Summary
- Module Summary
- Procedure Summary
- Call Graph Profile
Interpretation of the summary profiles is straight-forward. For the each procedure, module, and for the entire program run, the time spent in that program component is given. These times exclude time spent in subroutine calls, allowing you to pinpoint exactly which routines or modules are using the most time in your application. Timing results are given in terms of both wall clock time and as a percentage of total time for the application. Profile output uses a number of abbreviations. A key to abbreviations is given at the top of the profile output listing.
Reading the Call Graph Profile
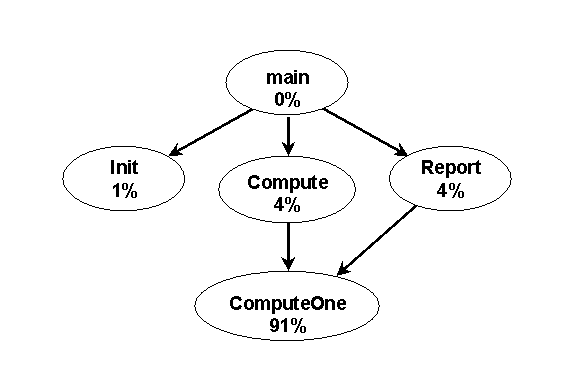
Proifle output from the Etch Call Graph Profiler uses the call graph, the dynamic pattern of procedure invocations, to give structure to the presentation of profile information. The nodes in the call-graph correspond to procedures, and the edges in the call graph to a caller/callee relationship between a pair of procedures. In the example illustrated in Figure 1, the procedure main() calls three procedures, Init(), Compute(), and Report(). Because the procedure calls made by a program can vary depending on the input data, the call graph for a program will vary from run to run. In the call graph in Figure 1, each procedure has been annotated with time spent executing instructions in that procedure as a percent of total time, excluding time in descendants in the call graph. This is called the self time for the procedure, and is the measure typically reported by conventional (flat) profiling tools. The sum of the self times for all the procedure should be 100%.

Figure 1. Call graph annotated with self times.
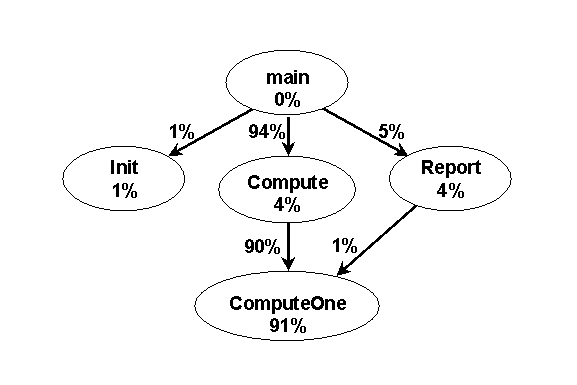
The limitation of the flat profile information in Figure 1 is that it only provides results at the procedure level. A more useful profile would give information about which sub-graphs of the call graph were using the most time. As an example, both Compute() and Report() call ComputeOne(), but it's impossible to tell from the flat profile information how much of the time in ComputeOne() is due to calls from Compute() and how much is due to calls from Report(). The hierarchical profile addresses this problem by monitoring descendant time for all call graph edges. In Figure 2 the edges in the call graph have been annotated with descendant times, showing 90% of the time in the program is due to calls to ComputeOne() from Compute(), and only 1% due to the calls from Report(). The profile output includes self and descendant time for all edges in the call graph, as well as total time for each procedure. The total time for a procedure is simply the sum of the self time and the descendant time.

Figure 2. Call graph annotated with self times and descendant times.
The call graph profile includes a multi-line major entry for each node in the call graph. The call graph contains exactly one node for each procedure used by the application, so there will be one major entry for each procedure, sorted by the total time for the procedure. Each major entry is composed of multiple minor entries, one for the procedure itself and one for each of the procedures that call or are called by the procedure. By default, cgprofile.exe omits major entries for procedures that make a negligible contribution to overall execution time. The /threshold switch to cgprofile.exe can be used to control this feature.
Within the major entries, minor entries for the callers or parents of the procedure are given first. These correspond to edges into the procedure node in the call graph. Next is the minor entry for the procedure itself, and finally a minor entry for each procedure called by the procedure, its children. Continuing our example, Figure 3 shows the major entry for the procedure main().
    parents
 total     self   desc     calls   percent
    children
. . .
-----------------------------------------------------
         1.480us  5.0 sec      1    100%   EXAMPLE.EXE   mainCRTStartup [0:5]
5.0 sec  1.480us  5.0 sec      1    100%   EXAMPLE.EXE   main [0:4]=
         200.0ms  4.5 sec      1   94.0%   EXAMPLE.EXE   Compute [0:2]
         50.00ms    ---        1    1.0%   EXAMPLE.EXE   Init [0:1]
         200.0ms  50.00ms      1    5.0%   EXAMPLE.EXE   Report [0:3]
. . .
Figure 3: Example Hierarchical Profile Output.
When a Windows program is run, the first procedure invoked is typically an initialization routine provided by the language runtime system that sets up the state of the running program, mainCRTStartup() in this example. This is the procedure that calls the top-level procedure in your program, typically main() for C console applications and WinMain() for window-based interactive applications. The profiler knows about this procedure, even though you didn't write it, so it appears as the parent of main() in Figure 3. As with all routines, the profiler will not know the name of this routine unless debug information is provided. In this example, debug information for the C runtime was included by compiling with the /MTd flag. To make it easier to locate procedures in the profile output, the profile output provides an index for each procedure, a unique identifier for the procedure. The index for mainCRTStartup() is [0:5]. The minor entry for mainCRTStartup() also includes self and descendant time for the call graph edge between mainCRTStartup() and main(). So, 1.480 microseconds of the execution time was spent in the call to main() from mainCRTStartup(), and (approximately) 5 seconds was spent in descendants of main(). The output also shows that mainCRTStartup() called main() once.
Minor entries for parent nodes are followed by the minor entry for the procedure itself, indented to the left to make it easy to identify. It shows that main() is responsible for (approximately) 100% of program execution time (the total time), with 1.480 microseconds in the code that implements main() itself (the self time) and about 5 seconds in the procedures called by main() (the descendant time). The last column shows that main() was called a total of one time during the execution of this program.
The remainder of the major entry for main() consists of the minor entries for all procedures called by main(). Each minor entry shows the self time and the descendant time for the edge from main() to each of its children. For example, the minor entry for Compute() shows that main() calls Compute() once, and that during that call 200 milliseconds is spent in Compute() (the self-time for the call from main() to Compute()) and 4.5 seconds is spent in descendants of Compute().
Call Graph Profile Format Summary
In review, each major entry in the profile output corresponds to a node in the call graph, which corresponds to exactly one procedure. Here's a summary of all the fields in a major entry. In this summary we will use node to refer to the procedure that is associated with the node in the call graph, parent to refer to parents of (edges into) the node, and children to refer to children (edges out) of the node.
Parent Entries
- self time for node due to calls from parent
- descendant time for node during calls from parent
- total number of calls from parent to node
- percent of total time spent in calls to node from parent
- module and procedure name for parent, if available
- the unique index for parent
Node Entries (indented to the left)
- total time (self + descendant) for node
- self time for node
- descendants time for node
- total number of calls to node from all parents
- percent of total time spent in calls to node
- module and name for node, if available
- the unique index for node
Child Entries
- self time for child due to calls from node
- descendant time for child during calls from node
- total number of calls from node to child
- percent of total time spent in calls to child from node
- module and procedure name for child, if available
- the unique index for child
Copyright (c) 1997 The University of Washington. All rights reserved.